Windy.app
iOS, Web
B2C
Jun 2022 – Jun 2025
Role: Senior Product Designer — UX, maps, forecasting, data visualization
Focus: Built clear UX for complex weather data: depth maps, radar, tides, spot insights.
Team Impact: Improved activation and retention via UX/UI upgrades and experiments.
Focus: Built clear UX for complex weather data: depth maps, radar, tides, spot insights.
Team Impact: Improved activation and retention via UX/UI upgrades and experiments.


Product Overview
Windy.app is a mobile weather app that consistently ranks in the Top 10 of the US App Store Weather category.
It combines outdoor-meteorology expertise with clear, intuitive visualizations to help beginners, pro athletes, and weather enthusiasts make better decisions on the water and on land.
Users:
kiters, SUP-paddlers, paragliders, surfers, yachtsmen-racers, freedivers, fishermen, boat captains, windsurfers, and others
Context:
Mobile, Tablet, iOS + Android

Outdoor & water sports
Fast, readable conditions for wind- and water-driven activities.
Advanced
weather tech
weather tech
Radar + nowcast
Real-time radar and short-term nowcasting in one flow.
Real-time radar and short-term nowcasting in one flow.
Built for anglers
Fishing layer and spots.
Bathymetry + conditions to find structure and plan the bite.
Bathymetry + conditions to find structure and plan the bite.
Yachting & boating
Marine weather & forecast.
Sea forecasts with layered maps for safer routes.
Sea forecasts with layered maps for safer routes.
Product Goals
Weather Accuracy
Turn wind, waves, tides, and radar into reliable, actionable insights.
Bathymetry
& Depth Maps
& Depth Maps
Provide intuitive depth, fog, and radar layers for safer navigation.
Segment Growth
Create value for sailors, surfers, anglers, and beginners to expand reach.

Spot Intelligence
Make spot forecasts clearer, more predictable, and easier to scan.
User Clarity
Reduce cognitive load by simplifying meteorological complexity.
Trust & Reliability
Improve weak features to boost forecast confidence and retention.
- Weather AccuracyTurn wind, waves, tides, and radar into reliable, actionable insights.
- Spot IntelligenceMake spot forecasts clearer, more predictable, and easier to scan.
- Bathymetry & Depth MapsProvide intuitive depth, fog, and radar layers for safer navigation.
- User ClarityReduce cognitive load by simplifying meteorological complexity.
- Segment GrowthCreate value for sailors, surfers, anglers, and beginners to expand reach.
- Trust & ReliabilityImprove weak features to boost forecast confidence and retention.

Real-world Context
Behind Key UX Decisions
Behind Key UX Decisions
-
 Wind drives everything
in outdoor sportsGusts, direction, and stability affect safety and performance. Wind cues must be readable at a glance. -
 Why visuals matter
more than numbersMaps and charts reveal patterns faster than tables. Scale, contrast, and data “relief” make decisions easier. -
 Balancing different
mental modelsPros want depth; beginners need guidance. The UI should serve both without overload. -
 Users need clarity —
not “raw” dataDecisions happen under uncertainty and time pressure. We translate complex weather data into clear visual signals.
Roles & Product Ownership
-
 Senior Product Designer (UI/UX)
2023-2024Focus:
core product UX + data visualization
1. Spot Page redesign (core surface)- Reframed wind/gusts/tides/temperature visuals for faster scanning
- Improved forecast readability and perceived reliability
2. UX iteration & research loop- Hypotheses → interviews + unmoderated tests → small shipped iterations
- Tight collaboration with PM, engineers, and meteorologists
3. Systematizing data UX- Shared rules for charts, tables, and color scales
- A/B tests impacting activation and retention
-
 Data Vizualization
& Map Design
(specialization)
2023-2025Focus:
geodata, cartography, and weather layers
1. Marine data & bathymetry- End-to-end US bathymetry map design: depths, contours, soundings, lakes
- Integrated multiple datasets with data science partners
2. Weather layers & visual systems- Radar UX + nowcast timeline control
- Visual language for waves, tides, and marine layers
3. Scientific accuracy across scales- Fog layer with DS engineer: density + visibility model
- Validated correctness with cartographers and meteorologists
-
 Team & Process ContributionsFocus:
processes, experimentation, cross-functional work
1. Experiments & growth- Testing loop for paywalls and onboarding funnels
- Framework for experiment analysis and insight synthesis
2. Team sync & delivery- Better collaboration across design, engineering, DS, and meteo
- Co-led experiments → turned winners into permanent features
3. Explaining complex tech to users- Helped craft clear messaging around the EXP3 AI model value
Design challenges

New Spot Page
Responsibility
Senior Product Designer for the Spot Page team. Owned forecast IA + data-viz quality; partnered with Growth and Engineering.
What we did (and my part)
We redesigned the Spot Page for fast, confident decisions. I led the forecast IA and data-viz model (wind color scale + chart clarity) and aligned map/forecast UX with engineering. A second designer drove UI execution and delivery.
Outcome
Engagement/retention improved (NDA). Patterns became a foundation for a data-focused design system module.
Bathymetric Map (USA)
Responsibility
Led bathymetry design in a dedicated “killer feature” squad.
Led bathymetry design in a dedicated “killer feature” squad.
What we did (and my part)
I designed the depth visual style from scratch—contours, soundings, and water bodies—and worked with a DS engineer to merge multiple data sources via Mapbox JSON. The goal was a map that stays data-rich while remaining readable across zoom levels.
I designed the depth visual style from scratch—contours, soundings, and water bodies—and worked with a DS engineer to merge multiple data sources via Mapbox JSON. The goal was a map that stays data-rich while remaining readable across zoom levels.
Outcome
The feature launched with strong product signals (details under NDA) and became a visible competitive advantage for marine navigation and fishing use cases.
The feature launched with strong product signals (details under NDA) and became a visible competitive advantage for marine navigation and fishing use cases.

Find the fish by depth
Depth contours reveal drop-offs and structure
— the spots where target species tend to gather.
Depth contours reveal drop-offs and structure
— the spots where target species tend to gather.
Find the fish by depth
Depth contours reveal drop-offs and structure
— the spots where target species tend to gather.
Depth contours reveal drop-offs and structure
— the spots where target species tend to gather.
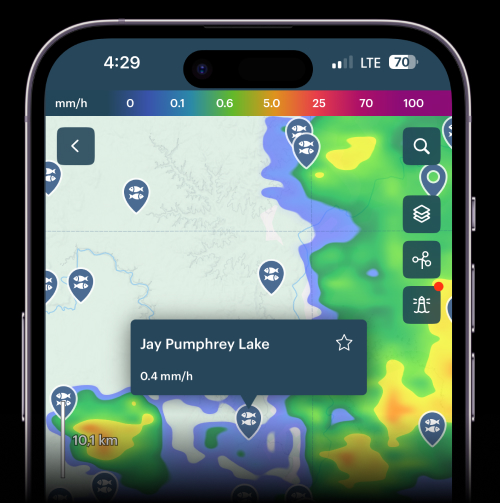
Precipitation Radar (Global)
Responsibility
End-to-end design for the Global Precipitation Radar layer.
End-to-end design for the Global Precipitation Radar layer.

A supercell thunderstorm visualization.
The radome of the NEXRAD WSR-88D (NOAA archive).
The process of scanning a cloud with radar.
The devastating consequences of hurricanes that radar can now detect.
The radome of the NEXRAD WSR-88D (NOAA archive).
The process of scanning a cloud with radar.
The devastating consequences of hurricanes that radar can now detect.
What we did (and my part)
I designed the radar UX + nowcast timeline, defined visuals for weak/strong fronts across zoom levels, and ran discovery with meteo + DS. Partnered with data science/engineering to ensure correct rendering across scenarios.
I designed the radar UX + nowcast timeline, defined visuals for weak/strong fronts across zoom levels, and ran discovery with meteo + DS. Partnered with data science/engineering to ensure correct rendering across scenarios.
Outcome
Radar became a key retention driver (NDA) and a foundation for radar as a sub-product.
Radar became a key retention driver (NDA) and a foundation for radar as a sub-product.
Onboarding, Paywalls, Feature-tours (Growth Loop)
Responsibility
Growth design for premium activation (onboarding, paywalls, feature tours).
Growth design for premium activation (onboarding, paywalls, feature tours).
What we did (and my part)
With the Head of Marketing, I shipped rapid test batches (10–12 paywalls, 2–3 funnels), kept only winners, and tailored messaging/visuals by user segments.
With the Head of Marketing, I shipped rapid test batches (10–12 paywalls, 2–3 funnels), kept only winners, and tailored messaging/visuals by user segments.
Outcome
Monetization metrics improved (NDA) and we built a repeatable experimentation playbook for design/marketing.
Monetization metrics improved (NDA) and we built a repeatable experimentation playbook for design/marketing.

EXP3 – AI-Based Weather Model (Global)
Responsibility
Onboarding + in-app marketing for EXP3, our AI-based weather model (promo assets + paywalls).
Onboarding + in-app marketing for EXP3, our AI-based weather model (promo assets + paywalls).
What we did (and my part)
I defined the visual language and messaging for EXP3, translated a complex AI concept into simple in-product explanations, and built in-app narratives that highlight when/why EXP3 outperforms other models.
I defined the visual language and messaging for EXP3, translated a complex AI concept into simple in-product explanations, and built in-app narratives that highlight when/why EXP3 outperforms other models.
Outcome
EXP3 became a key product differentiator (metrics under NDA), and users better understood where EXP3 is the best choice.
EXP3 became a key product differentiator (metrics under NDA), and users better understood where EXP3 is the best choice.
Visual Design

Achievements
and Impact
and Impact
NDA: Detailed metrics are protected, as Windy.app operates in a highly competitive, industry-leading weather market.
-
 Stronger Core
Product Experience- Spot Page became faster to read and more reliable in harsh weather conditions.
- Key parameters (wind, gusts, tide) are now instantly understandable on mobile screens.
- Improved speed and confidence in user decision-making.
-
 More Reliable Weather
& Depth Data- Refined the visual language for wind, waves, and tide.
- Added new layers (bathymetry and radar) to improve on-water safety.
- Data became more accurate and easier to interpret.
-
 Growth & Engagement
Improvements- Increased user engagement with key features.
- New onboarding improved product understanding and interest in Premium.
- A/B iterations strengthened key product signals.
My personal impact
& Key achievements
& Key achievements
I strengthened Windy.app by turning complex marine and weather data into clear, actionable UX. Owned core UX for spot forecasts, marine layers, maps, onboarding, and activation flows.
Driving product growth
Learned: activation improves only when value is obvious early.
Handled: rebuilt onboarding and key entry points, iterated via experiments, and strengthened signals for core + premium use.
Handled: rebuilt onboarding and key entry points, iterated via experiments, and strengthened signals for core + premium use.
Map UX craft at scale
Learned: map UX is about clarity under dense layers and states.
Handled: designed marine layers (depth, tides, fog/radar) and unified the visual language to reduce cognitive load.
Handled: designed marine layers (depth, tides, fog/radar) and unified the visual language to reduce cognitive load.
User-driven foundation
Learned: segment needs differ sharply across marine users.
Handled: ran quick interviews/tests, validated spot → map → forecast flows with prototypes, and fed discovery into iterations.
Handled: ran quick interviews/tests, validated spot → map → forecast flows with prototypes, and fed discovery into iterations.
Collaboration & delivery
Learned: complex domains need tight alignment across experts.
Handled: synced designers, engineers, meteorologists, and cartographers; improved reviews/docs; and kept delivery consistent.
Handled: synced designers, engineers, meteorologists, and cartographers; improved reviews/docs; and kept delivery consistent.
Try it yourself
Built for outdoor activities, tested with real users. Everything shown in this case is based on real usage and validated UX work.
All product rights and materials showcased in this case belong to Windy Weather World Inc. Copyright © Windy Weather World Inc.
Other Cases


May 2023 – Jul 2025 B2C
Role: Senior Product Designer — discovery, UX/UI, experiments
Focus: Designed data-dense marine weather interface, segmentation model and core map interactions.
Team Impact: 3.4× growth of active paid users, 2× retention improvement, 20+ validated experiments.
Role: Senior Product Designer — discovery, UX/UI, experiments
Focus: Designed data-dense marine weather interface, segmentation model and core map interactions.
Team Impact: 3.4× growth of active paid users, 2× retention improvement, 20+ validated experiments.


Jul 2025 – Nov 2025 B2C, build on public
Role: Solo Product Designer and owner
Focus: Designed a system of 186+ widgets, themes and mini-apps; created a tiny theme editor; shipped full visual language and interaction model.
Solo Impact: Independently delivered a full product lifecycle: market analysis, research, UX/UI, prototyping, development and App Store launch.


Feb 2022 – Oct 2022 B2B
Role: Product Designer — UX/UI for complex B2B data workflows
Focus: Designed data search and analysis experience; simplified workflows and information architecture.
Team Impact: Improved data discovery speed for analysts by ~30–40%, depending on scenario.
Role: Product Designer — UX/UI for complex B2B data workflows
Focus: Designed data search and analysis experience; simplified workflows and information architecture.
Team Impact: Improved data discovery speed for analysts by ~30–40%, depending on scenario.


Aug 2021 – Feb 2022 B2B
Role: Product Designer — UX/UI for trading flows
Focus: Designed product search, selling flow and trading network interactions.
Team Impact: Reduced friction in transaction flow and increased conversion.
Role: Product Designer — UX/UI for trading flows
Focus: Designed product search, selling flow and trading network interactions.
Team Impact: Reduced friction in transaction flow and increased conversion.


Mar 2020 – Jan 2022 B2B
Role: Product Designer — navigation and safety interfaces
Focus: Designed navigation dashboards, weather layers and emergency response flows.
Team Impact: Reduced time-to-decision for captains by improving clarity of critical information.
Role: Product Designer — navigation and safety interfaces
Focus: Designed navigation dashboards, weather layers and emergency response flows.
Team Impact: Reduced time-to-decision for captains by improving clarity of critical information.


Mar 2020 – Aug 2021 B2B
Role: Product Designer — UX/UI for geospatial threat tools
Focus: Designed ice-threat prediction maps and route-safety visualization tools.
Team Impact: Improved clarity of risk zones and reduced decision time in safety-critical scenarios.
Role: Product Designer — UX/UI for geospatial threat tools
Focus: Designed ice-threat prediction maps and route-safety visualization tools.
Team Impact: Improved clarity of risk zones and reduced decision time in safety-critical scenarios.


Jun 2018 – Jan 2019 B2C
Role: Product Designer — UX/UI for marketplace flows
Focus: Designed end-to-end flows connecting furniture studios and suppliers; built mobile and web experiences.
Team Impact: Improved conversion and simplified multi-step purchase/renovation journeys.
Role: Product Designer — UX/UI for marketplace flows
Focus: Designed end-to-end flows connecting furniture studios and suppliers; built mobile and web experiences.
Team Impact: Improved conversion and simplified multi-step purchase/renovation journeys.


Jan 2022 – Mar 2023 B2B/B2C
Role: Product Designer / Design System Owner
Focus: Built a scalable design system for industrial solutions — components, interactions and dev-ready documentation.
Team Impact: Accelerated delivery of new products and reduced design–dev inconsistencies.
Role: Product Designer / Design System Owner
Focus: Built a scalable design system for industrial solutions — components, interactions and dev-ready documentation.
Team Impact: Accelerated delivery of new products and reduced design–dev inconsistencies.


Jun 2018 — Sep 2024
Role: Designer / Developer / R&D
Focus: AR experiments, custom design tools, interaction prototypes and design system explorations.
Solo Impact: Strengthened technical versatility and experimentation skills beyond core product work.
Role: Designer / Developer / R&D
Focus: AR experiments, custom design tools, interaction prototypes and design system explorations.
Solo Impact: Strengthened technical versatility and experimentation skills beyond core product work.
